Section 6: Capabilities
Source summary for Section 6 (pages 183–197) of the Claude Mythos Preview System Card. Covers capability evaluations across coding, reasoning, math, long context, agentic search, and multimodal tasks.
Key Findings
- Claude Mythos Preview achieves best-in-class scores on every evaluation reported, often by wide margins over Claude Opus 4.6 and third-party models
- Contamination analysis is a major theme — Section 6.2 devotes substantial effort to demonstrating that gains aren’t explained by memorization
- SWE-bench results survive aggressive memorization filtering across all threshold levels
- MMMU-Pro omitted entirely due to unresolvable contamination concerns
Contamination (6.2)
Three benchmarks receive dedicated contamination scrutiny:
- SWE-bench — Claude-based auditor assigns memorization probabilities; sweeping the threshold across its full range preserves Mythos Preview’s lead. See Contamination Analysis.
- CharXiv Reasoning — Majority of question-answer text pairs confirmed present in training corpus. Held-out remix variants show all models score higher on remixes, suggesting limited memorization impact.
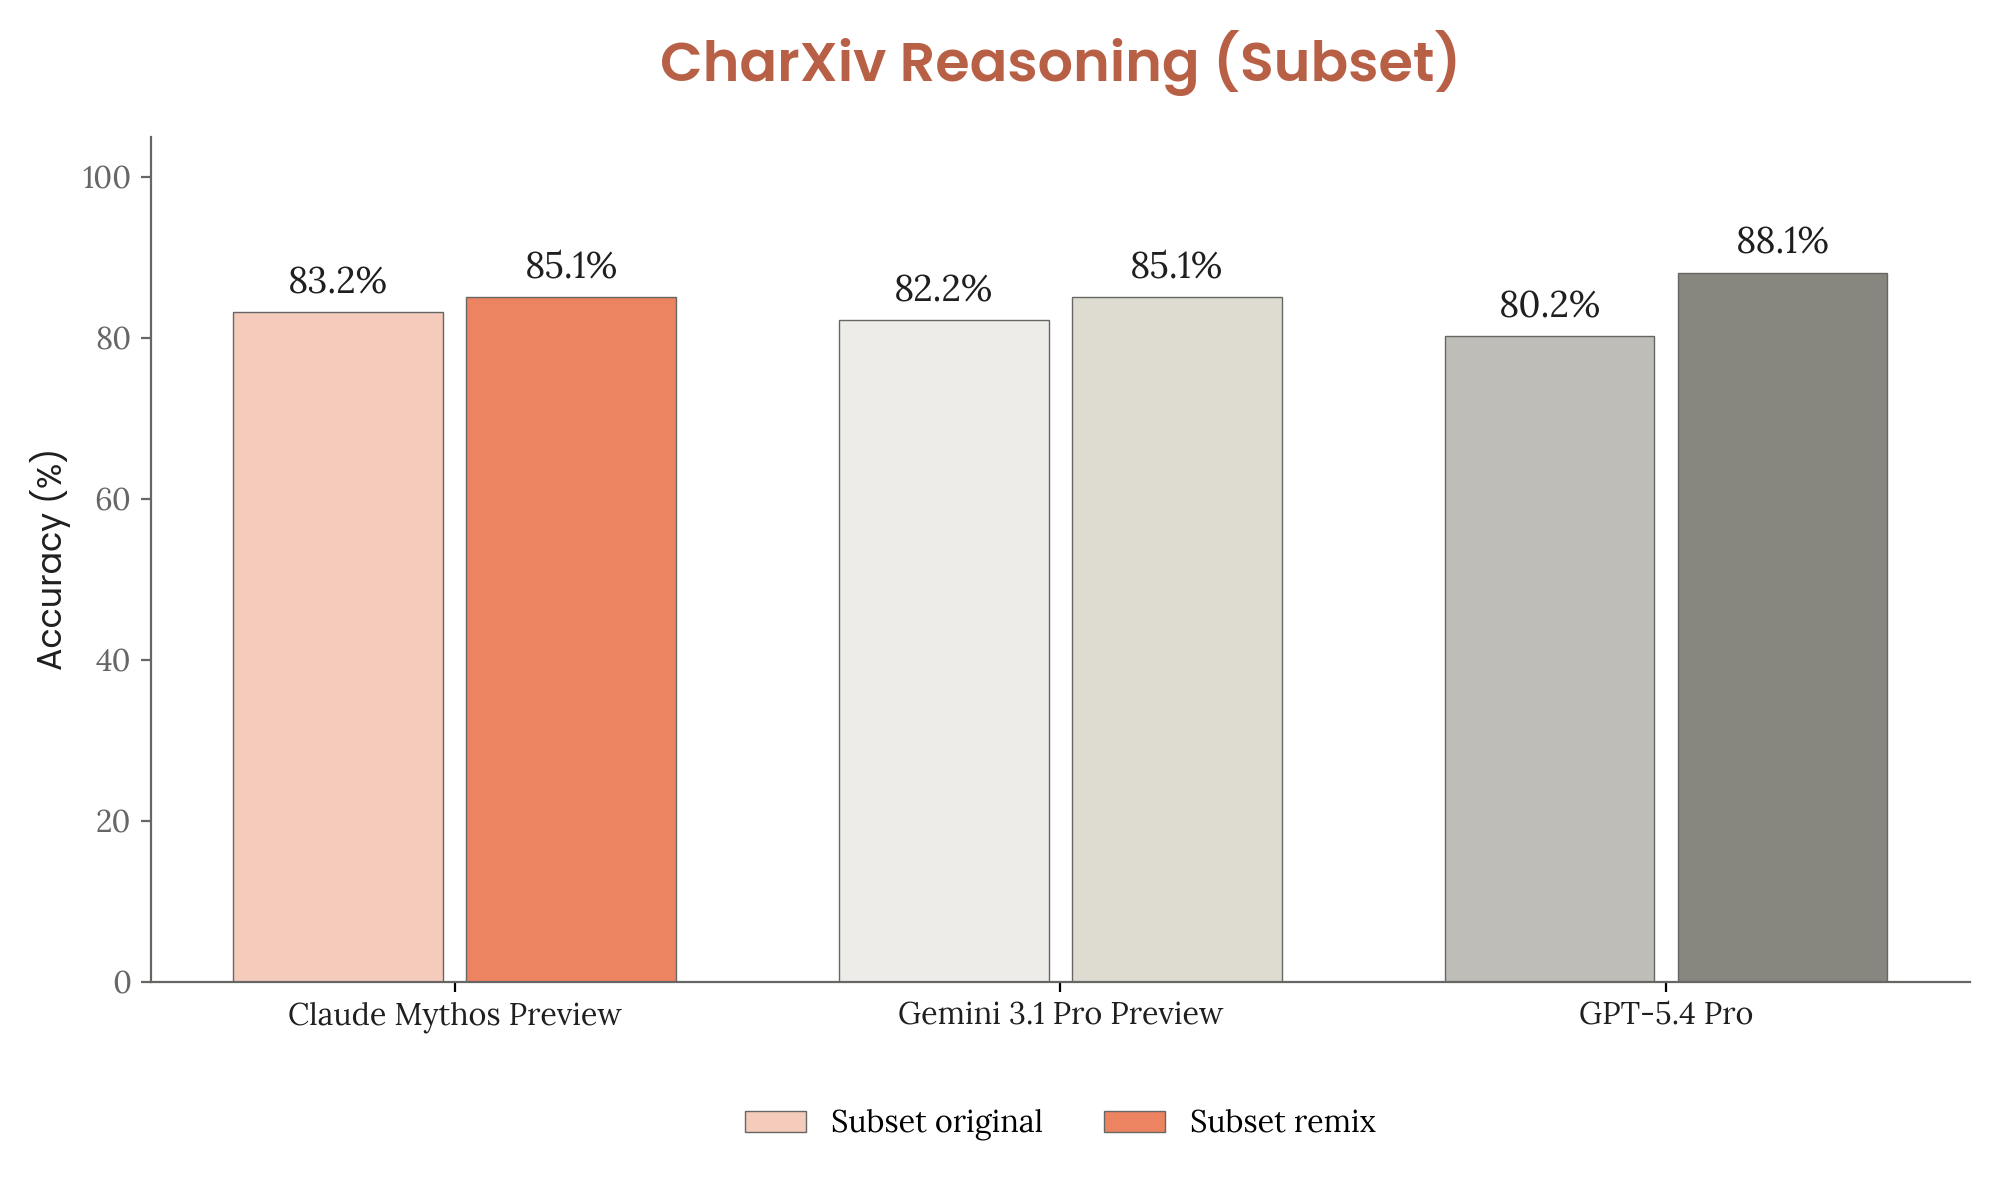
Figure 6.2.2.A — CharXiv original vs remix, p. 186. All models score slightly higher on remix than original (e.g. Mythos Preview 83.2% vs 85.1%), suggesting memorization has limited impact on CharXiv results.
- MMMU-Pro — Large fraction of images found in training data via textbooks and homework sites. Unlike CharXiv, difficulty-equivalent variants are hard to construct, so results are omitted from the system card entirely.
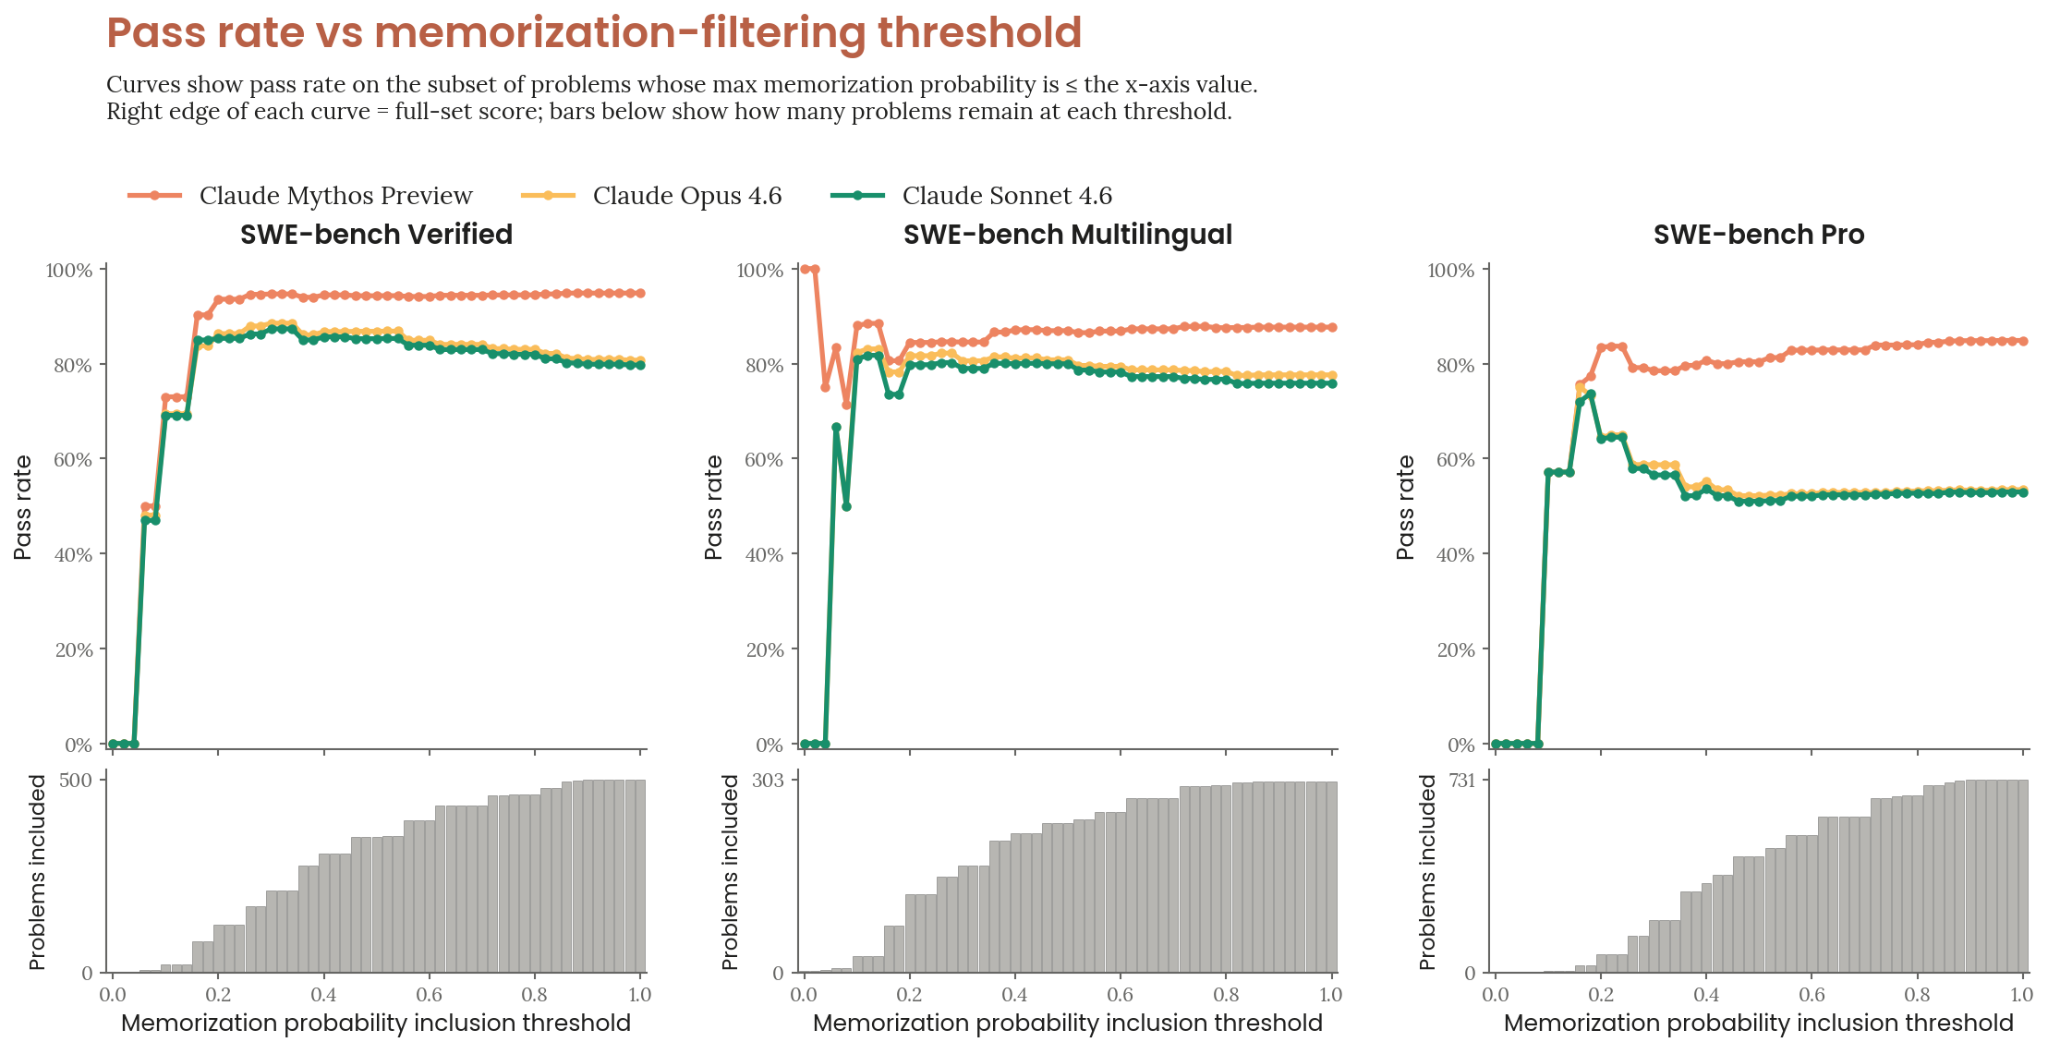
Figure 6.2.1.A — SWE-bench memorization filter, p. 185. SWE-bench pass rates remain stable across all memorization-filter thresholds, with Mythos Preview consistently highest — contamination does not explain the gains.
Overall Results (Table 6.3.A)
| Evaluation | Mythos Preview | Opus 4.6 | GPT-5.4 | Gemini 3.1 Pro |
|---|---|---|---|---|
| SWE-bench Verified | 93.9% | 80.8% | — | 80.6% |
| SWE-bench Pro | 77.8% | 53.4% | 57.7% | 54.2% |
| SWE-bench Multilingual | 87.3% | 77.8% | — | — |
| SWE-bench Multimodal | 59% | 27.1% | — | — |
| Terminal-Bench 2.0 | 82% | 65.4% | 75.1% | 68.5% |
| GPQA Diamond | 94.5% | 91.3% | 92.8% | 94.3% |
| MMMLU | 92.7% | 91.1% | — | 92.6–93.6% |
| USAMO 2026 | 97.6% | 42.3% | 95.2% | 74.4% |
| GraphWalks BFS 256K-1M | 80.0% | 38.7% | 21.4% | — |
| HLE (no tools) | 56.8% | 40.0% | 39.8% | 44.4% |
| HLE (with tools) | 64.7% | 53.1% | 52.1% | 51.4% |
| CharXiv Reasoning (no tools) | 86.1% | 61.5% | — | — |
| CharXiv Reasoning (with tools) | 93.2% | 78.9% | — | — |
| OSWorld | 79.6% | 72.7% | 75.0% | — |
Standard configuration: adaptive thinking at max effort, default sampling, averaged over 5 trials, up to 1M context.
Coding (6.4–6.5)
SWE-bench (6.4)
Four variants tested — Verified, Pro, Multilingual, Multimodal. All use standard configuration with thinking blocks. See swe-bench for details. Multimodal variant shows higher trial-to-trial variance (56.4–61.4%).
Terminal-Bench 2.0 (6.5)
82% mean reward across 445 trials (89 tasks × 5 attempts). See terminal-bench for details. With relaxed timeouts (2.1 fixes + 4-hour limit), score rises to 92.1% vs. GPT-5.4’s 75.3%.
Reasoning and Knowledge (6.6–6.8)
GPQA Diamond (6.6)
94.55% on 198 graduate-level science questions. Narrow margins between frontier models (91.3–94.5%).
MMMLU (6.7)
92.67% on multilingual knowledge across 57 subjects in 14 non-English languages.
USAMO 2026 (6.8)
97.6% on the 2026 USA Mathematical Olympiad (post-training-cutoff). Proof-based competition graded via MathArena methodology (panel of 3 frontier models, minimum score). Opus 4.6 scored only 42.3%.
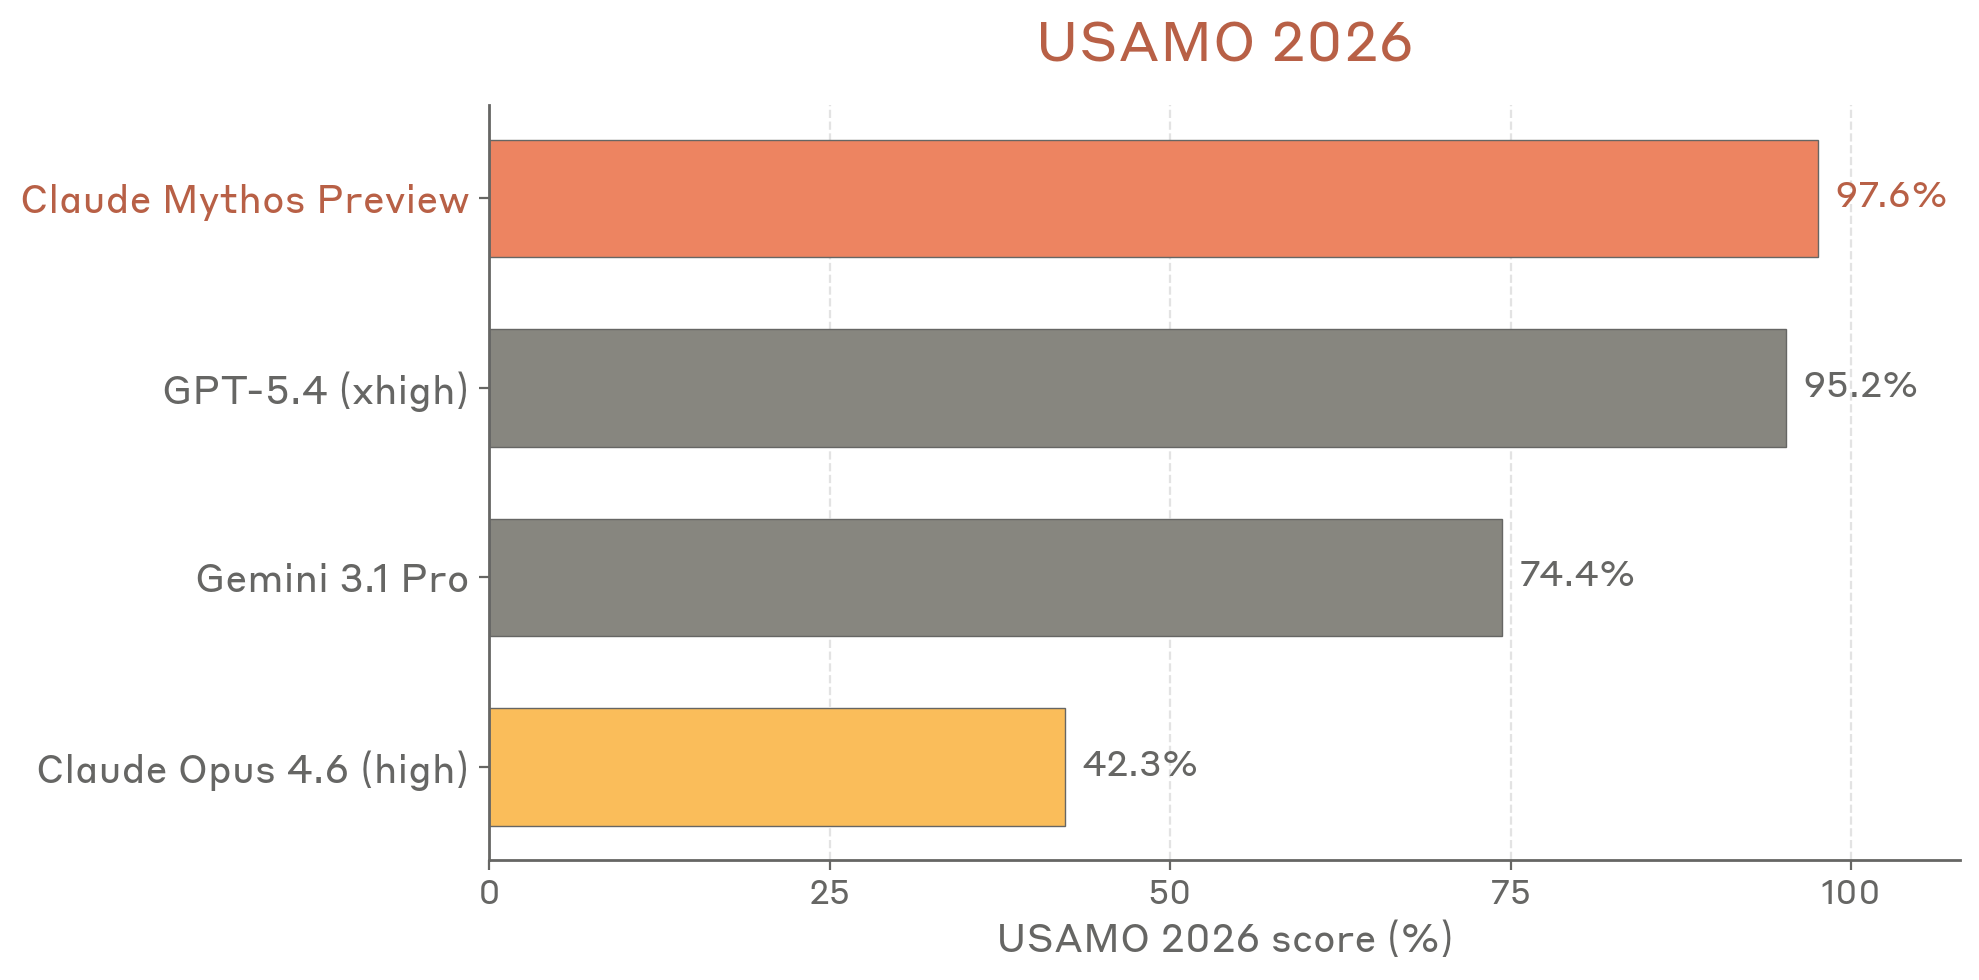
Figure 6.8.A — USAMO 2026 scores, p. 191. Mythos Preview achieves 97.6% on USAMO 2026, more than doubling Opus 4.6’s 42.3% and narrowly beating GPT-5.4’s 95.2%.
Caveat: two of three judges were Anthropic models, which may introduce bias — though Gemini 3.1 Pro agreed on 58/60 solutions.
Long Context (6.9)
GraphWalks
80.0% on BFS 256K-1M; 97.7% on parents 256K-1M. Tests multi-hop reasoning by performing BFS on graphs of hexadecimal-hash nodes filling the context window. Note: half the problems exceed the public API’s 1M token limit, so results aren’t fully reproducible.
Agentic Search (6.10)
Humanity’s Last Exam (6.10.1)
56.8% without tools; 64.7% with tools (web search, web fetch, code execution, context compaction at 50k up to 3M tokens). See humanitys-last-exam.
BrowseComp (6.10.2)
86.9% on hard-to-locate web information. Benchmark assessed as near saturation — only modest improvement over Opus 4.6 (83.7%), but with 4.9x fewer tokens per task (226k vs. 1.11M). No-thinking/no-tools baseline of 24.0% (15.1% for short transcripts) suggests limited but nonzero pretraining contamination.
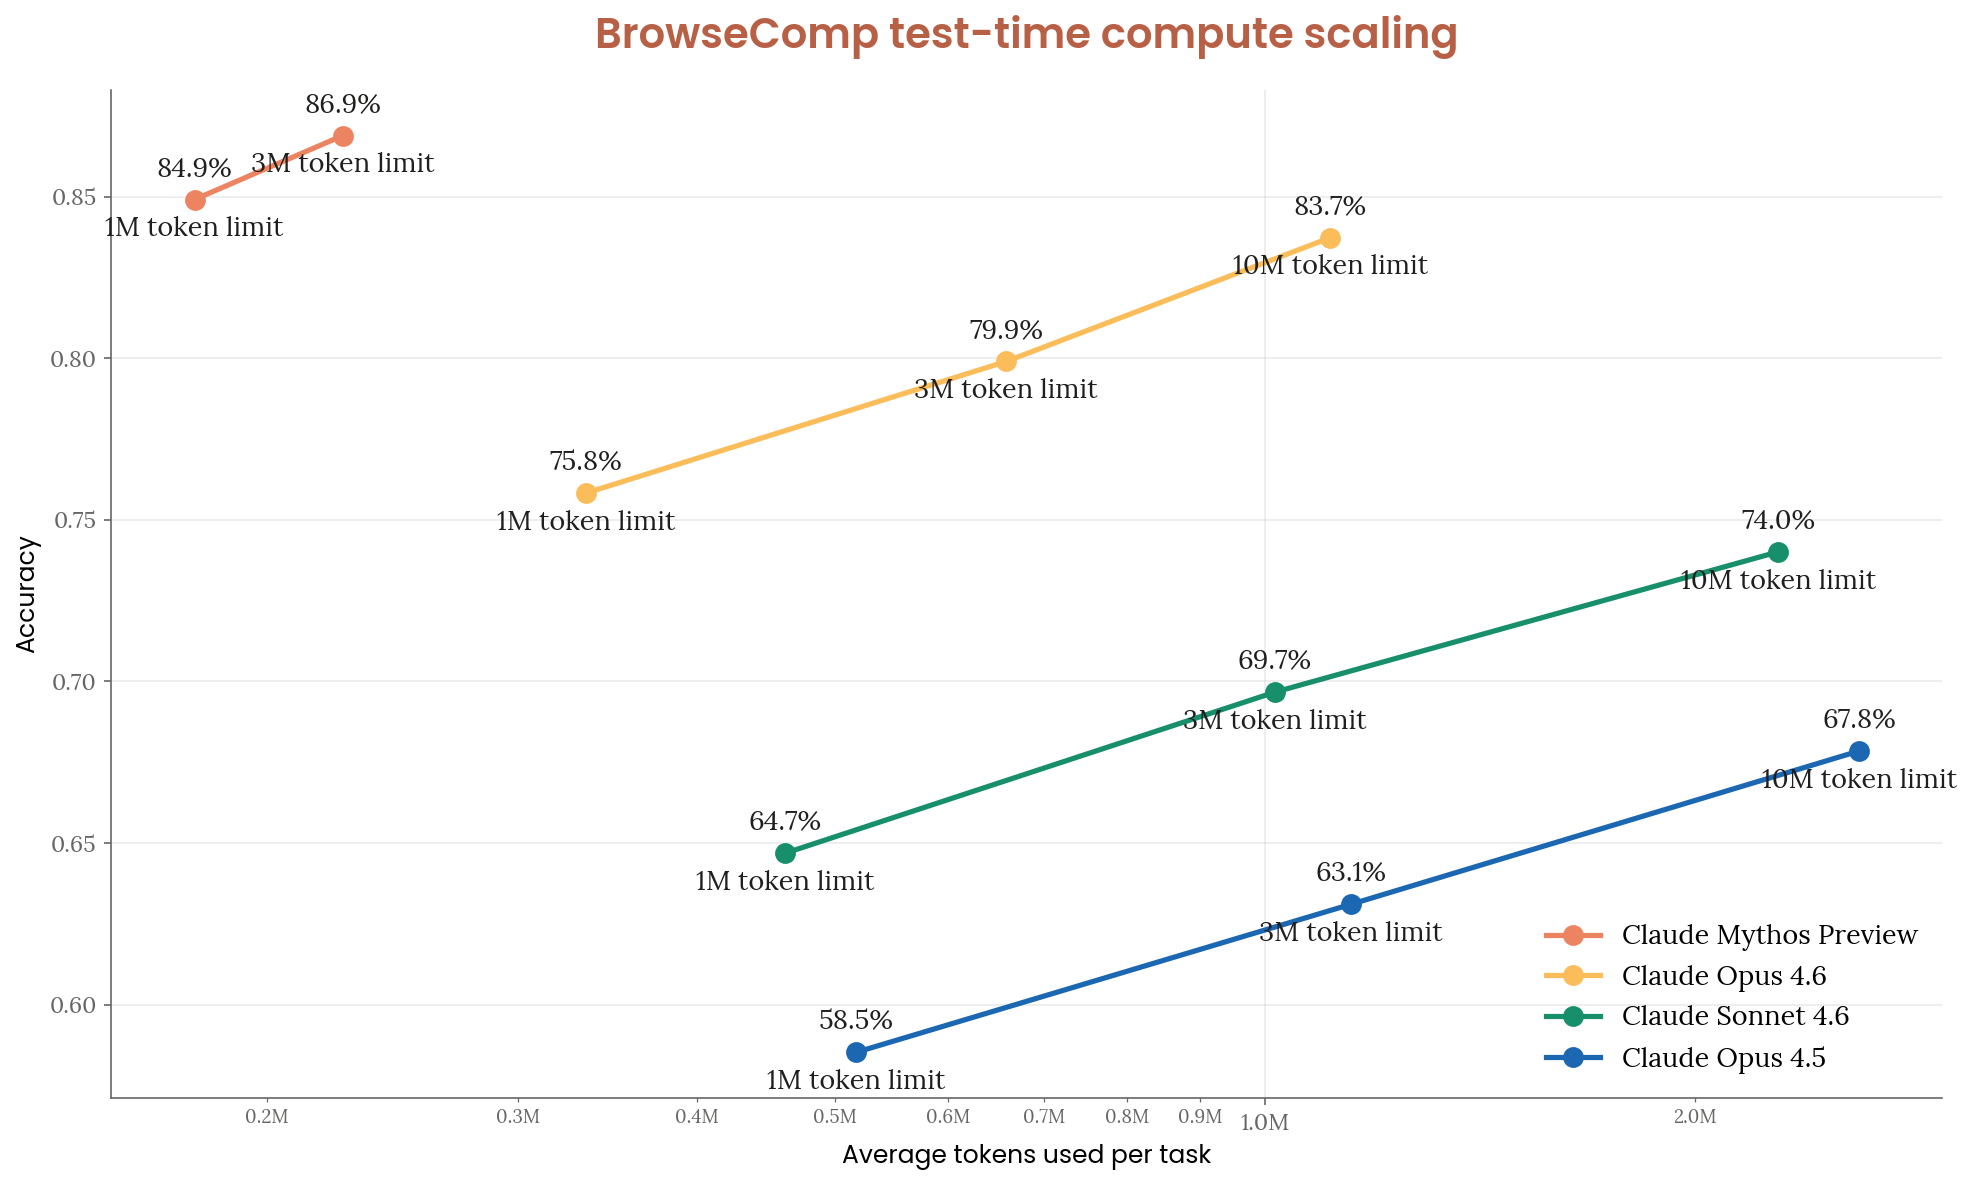
Figure 6.10.2.A — BrowseComp scaling, p. 193. Mythos Preview reaches 86.9% accuracy using 4.9x fewer tokens per task than Opus 4.6 (226k vs 1.11M), which tops out at 83.7%.
Multimodal (6.11)
Three methodology changes from prior system cards:
- Expanded Python tools (code-execution sandbox with PIL, OpenCV) alongside image-cropping
- Updated grader from Sonnet 4 to Sonnet 4.6 (prior grader had formatting failures)
- Thinking traces now preserved for grading (negligible effect except Opus 4.6 on CharXiv)
All prior models re-evaluated with the new setup for fair comparison.
LAB-Bench FigQA (6.11.1)
Interpreting scientific figures from biology papers. Mythos Preview: 79.7% no tools / 89.0% with tools (vs. Opus 4.6: 58.5% / 75.1%; expert human: 77.0%).
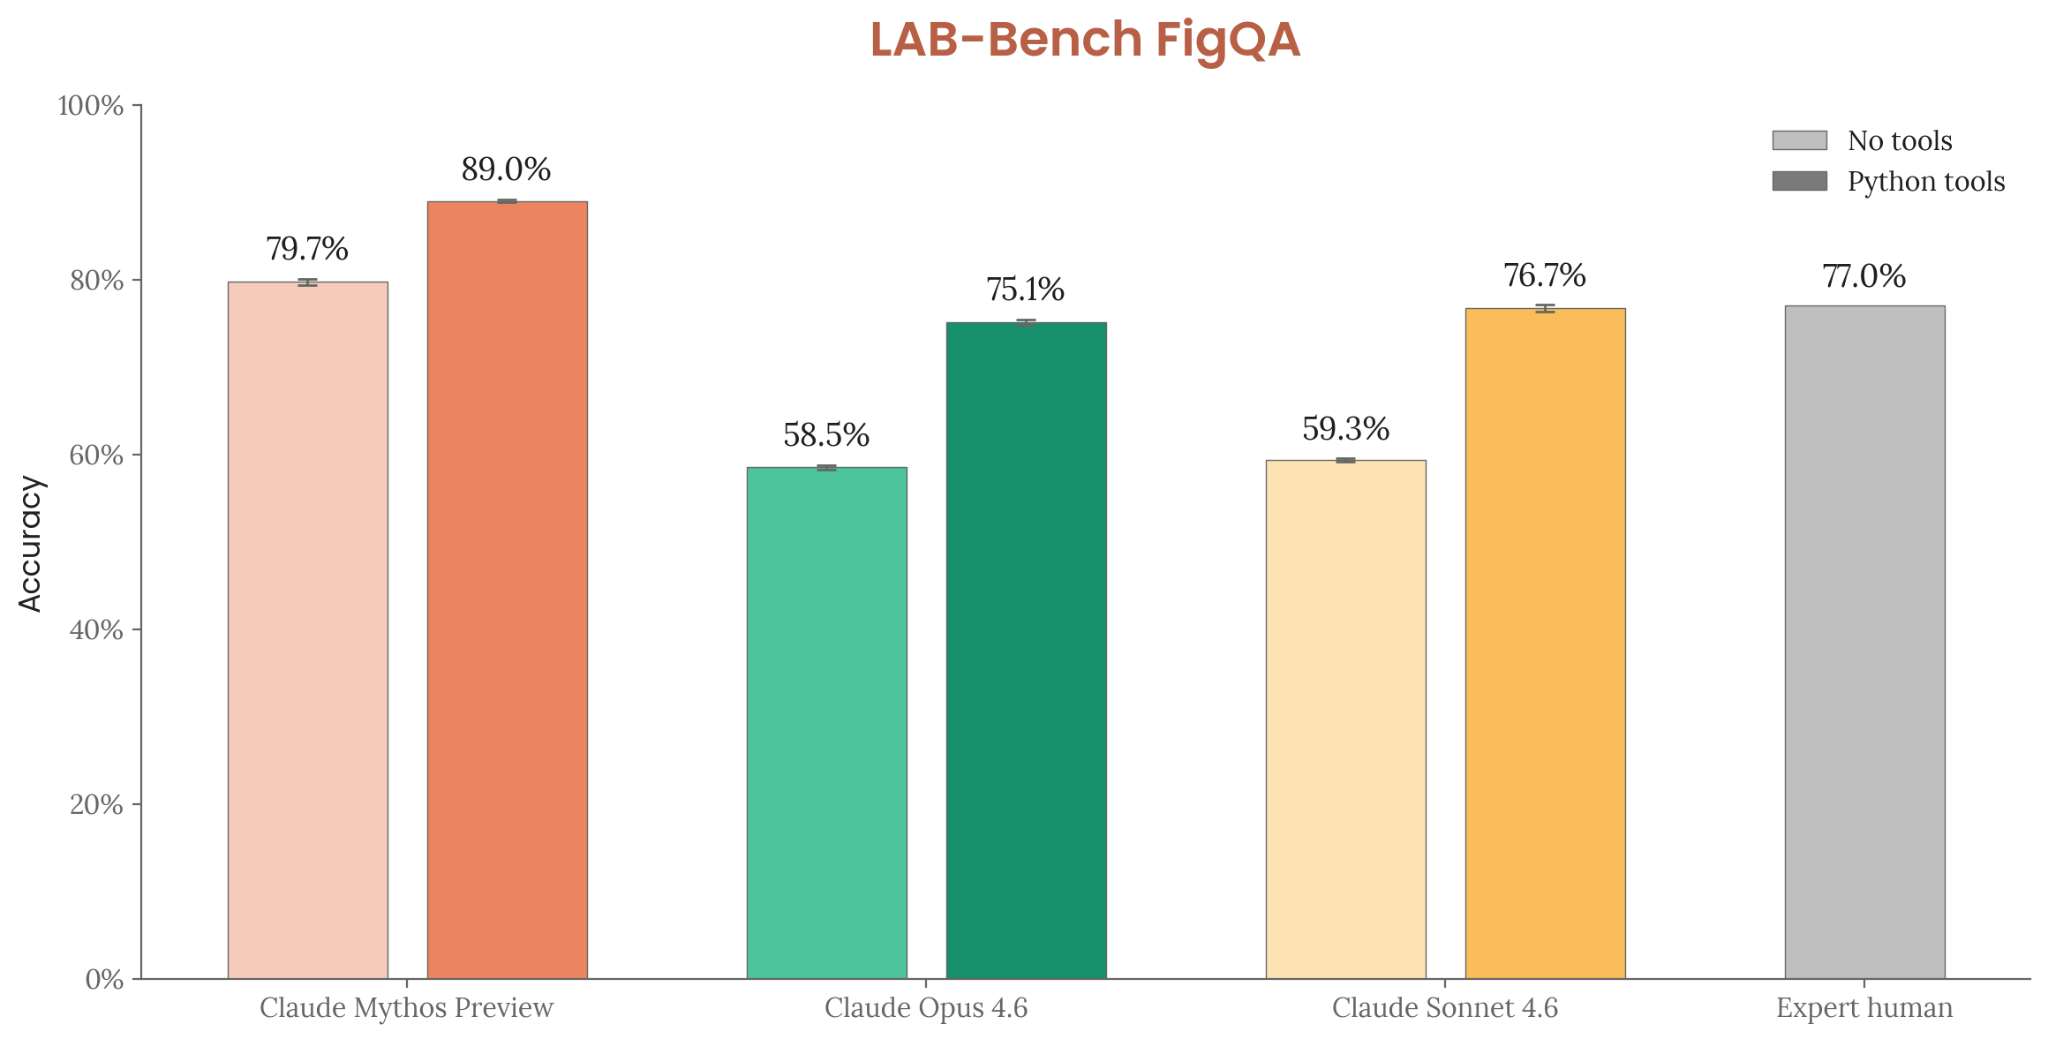
Figure 6.11.1.A — LAB-Bench FigQA, p. 195. Mythos Preview with Python tools (89.0%) substantially exceeds expert human performance (77.0%) on scientific figure interpretation.
ScreenSpot-Pro (6.11.2)
GUI grounding — locating UI elements in professional desktop app screenshots (1,581 tasks, elements <0.1% screen area). Mythos Preview: 79.5% no tools / 92.8% with tools (vs. Opus 4.6: 57.7% / 83.1%).
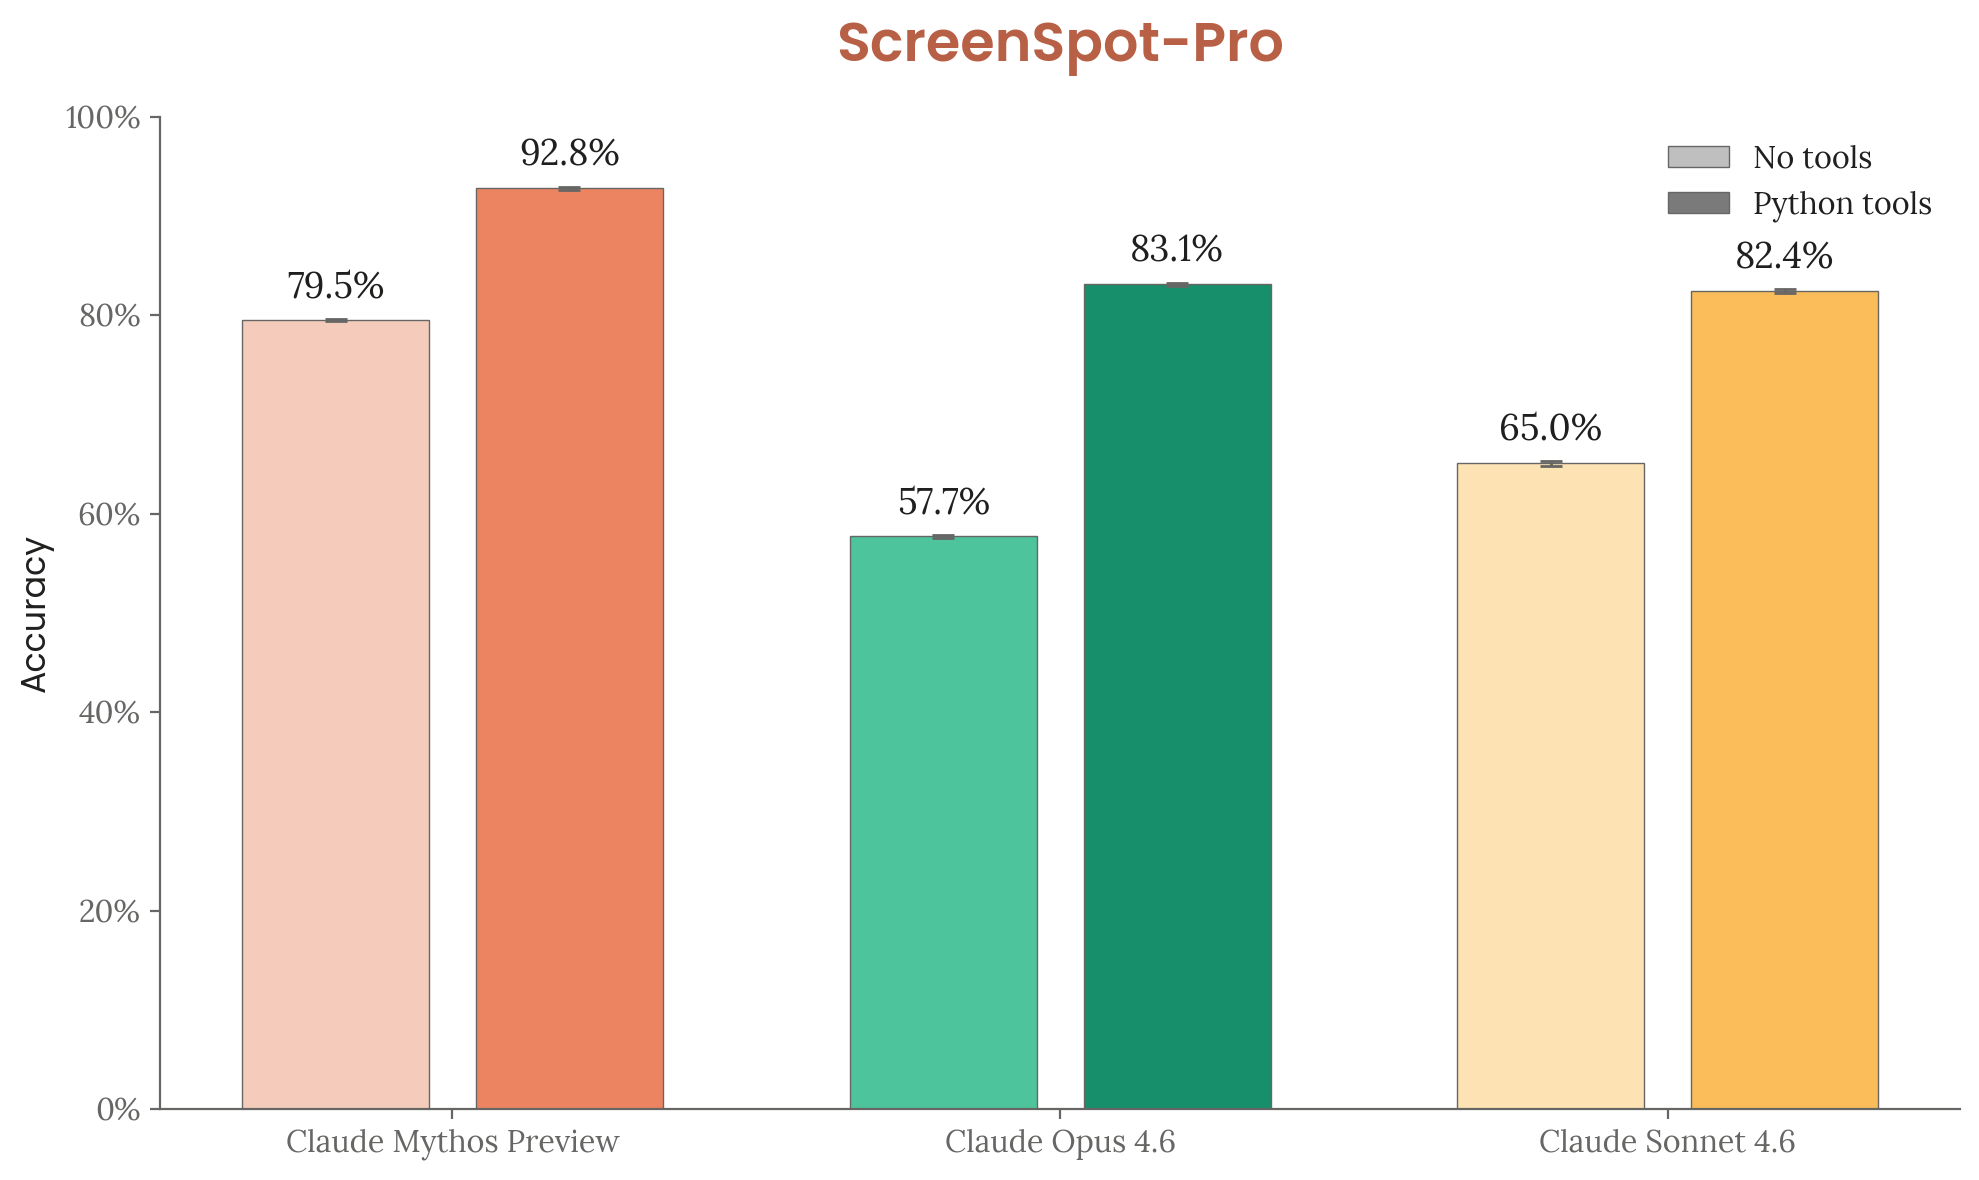
Figure 6.11.2.A — ScreenSpot-Pro, p. 196. Python tools boost Mythos Preview from 79.5% to 92.8% on GUI element grounding, a 15-25 percentage point gain seen across all models.
CharXiv Reasoning (6.11.3)
Chart understanding from 2,323 arXiv-sourced scientific charts. Mythos Preview: 86.1% no tools / 93.2% with tools (vs. Opus 4.6: 61.5% / 78.9%). See contamination analysis above.
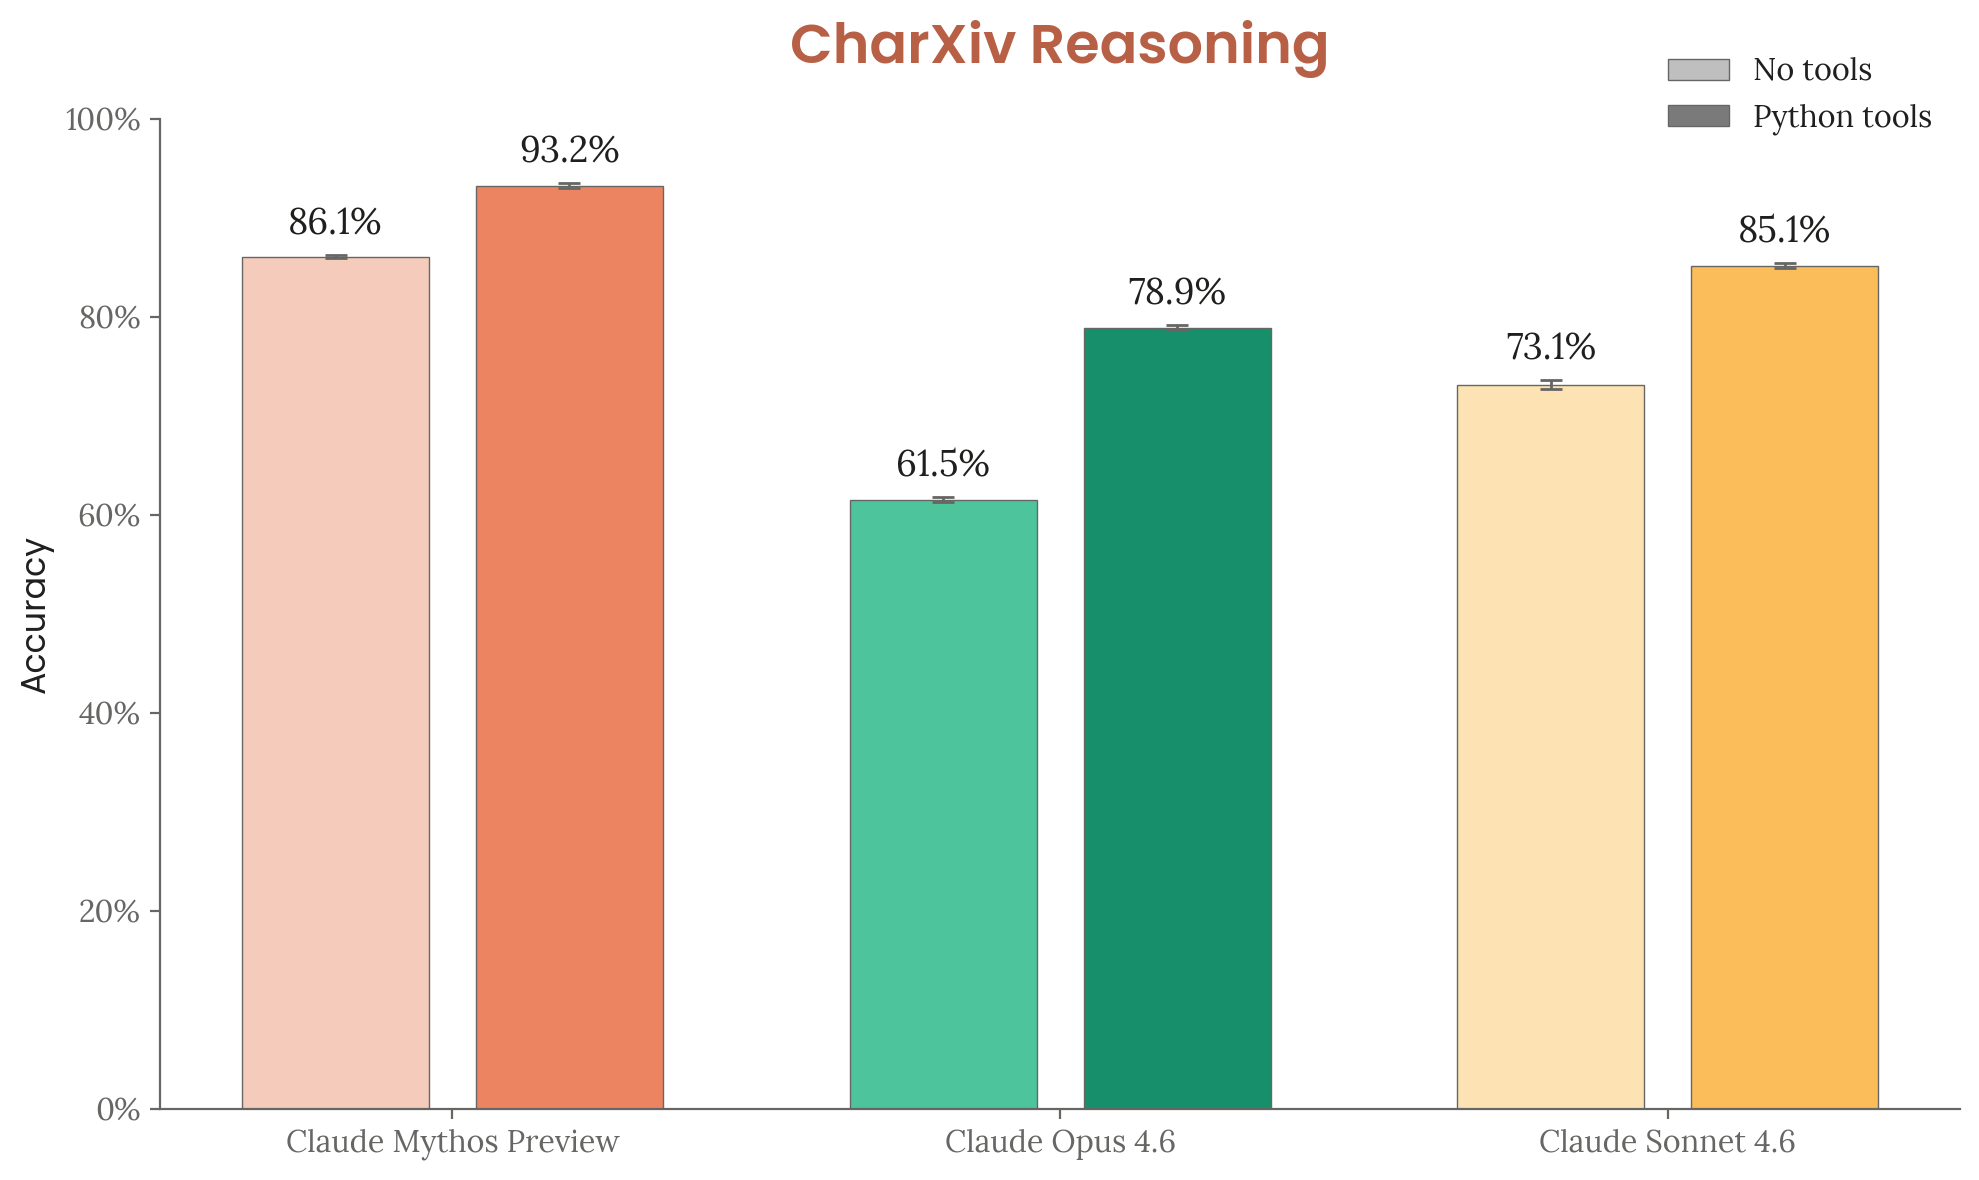
Figure 6.11.3.A — CharXiv Reasoning, p. 197. Mythos Preview with tools (93.2%) outperforms all other configurations by at least 8 percentage points, with a 31.7-point gap over Opus 4.6 without tools.
OSWorld (6.11.4)
Real-world computer tasks (documents, web browsing, file management) on a live Ubuntu VM. Mythos Preview: 79.6% first-attempt success rate (vs. Opus 4.6: 72.7%; GPT-5.4: 75.0%).